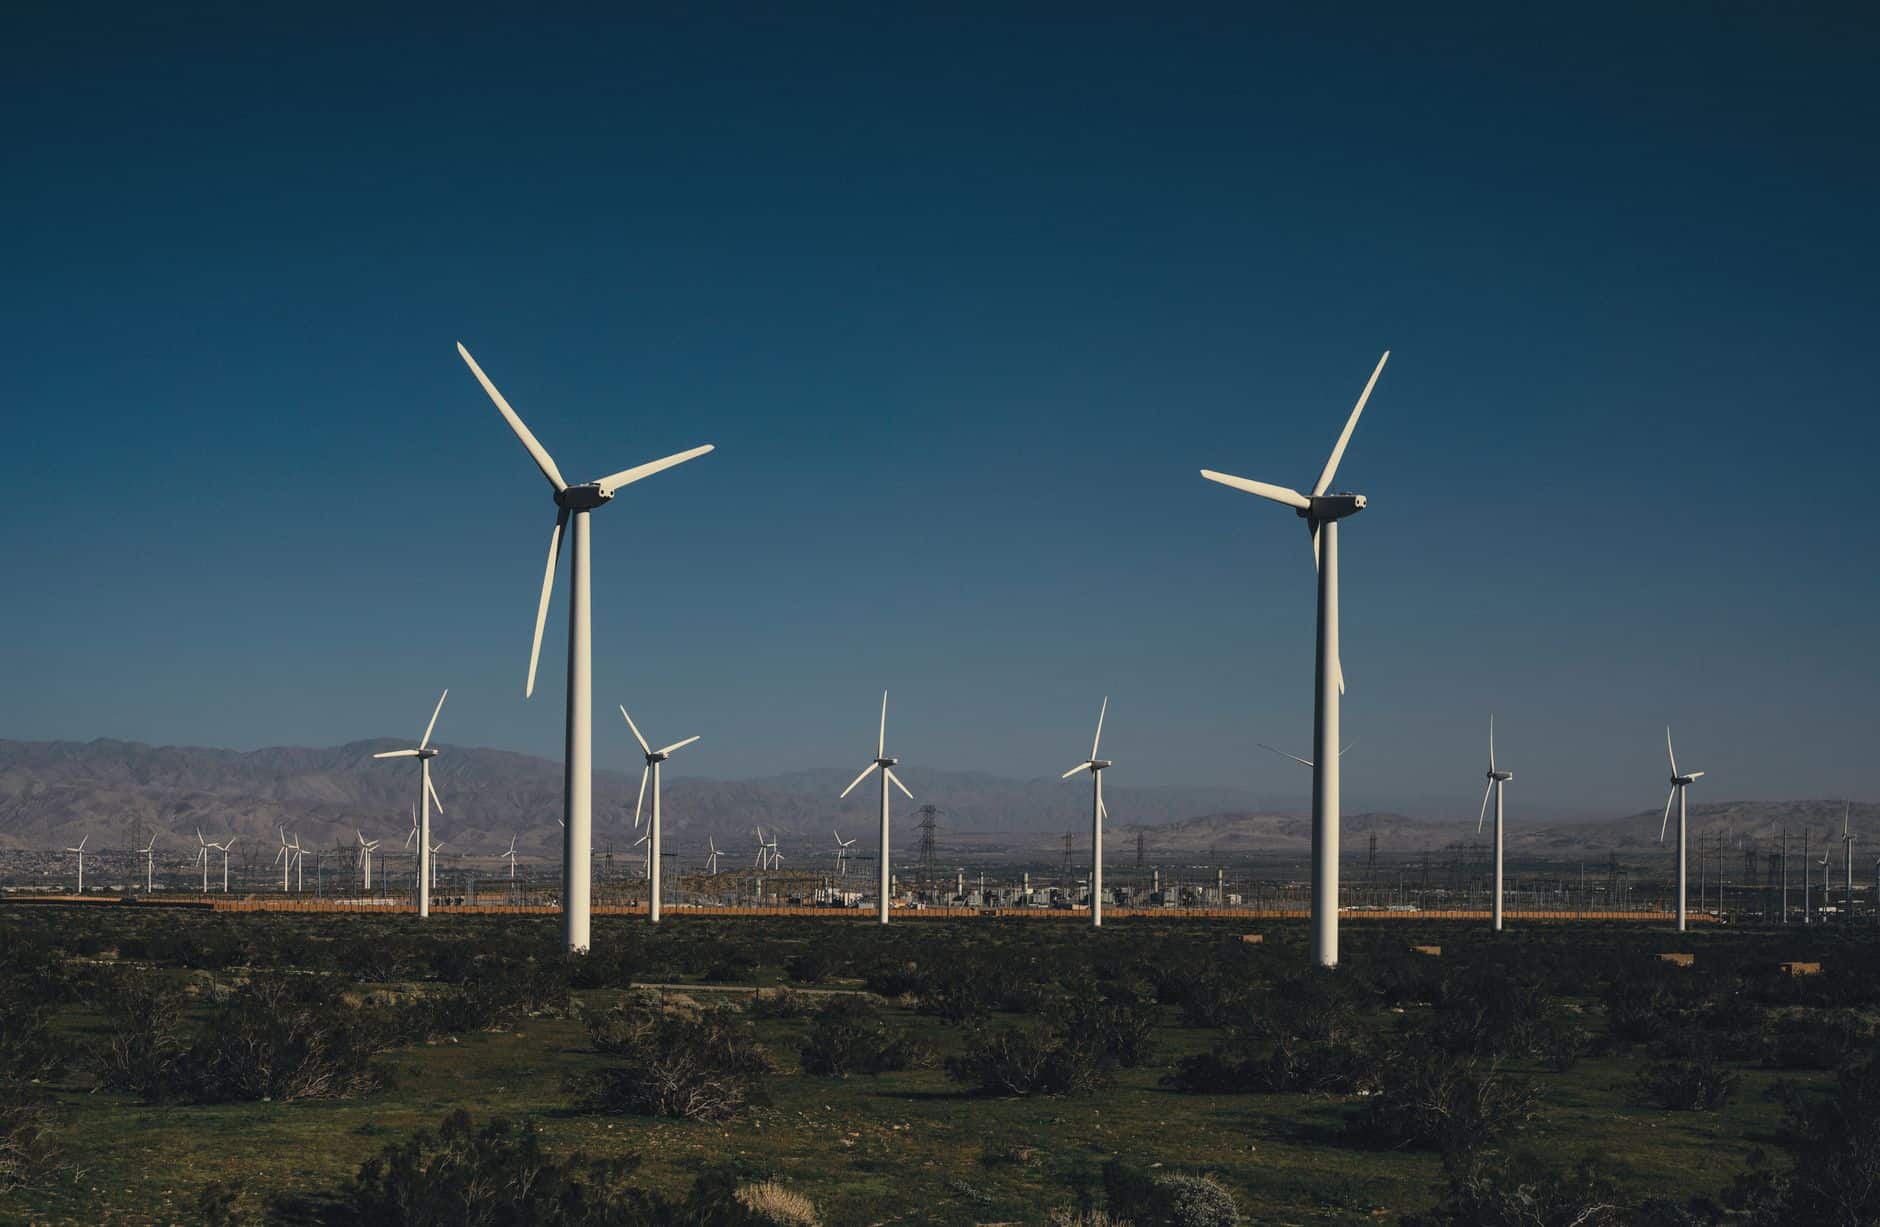
Solar is the fastest-growing electricity source on the planet, but cheap and clean aren’t the same thing. Here’s how every major energy source actually stacks up.
With all the news of AI (artificial intelligence) data centers sucking up energy in rural America, I started to become interested in where all that energy is coming from. We’ve all heard news about solar, wind and nuclear power, and obviously the conflict in Iran is impacting crude oil, so I wanted to take a deeper dive into the energy industry to see what the facts were. I was pleasantly surprised.
The global electricity system generates more than 30,000 terawatt-hours of power every year, and the fuel sources behind that output couldn’t be more different. Coal still accounts for roughly 34 to 35 percent of global generation. Wind and solar together are approaching 15 percent and climbing fast. Renewables and nuclear combined now cover more than 40 percent of global electricity.
Comparing these sources fairly requires three consistent metrics: electricity output (global share), environmental impact (lifecycle CO₂ emissions per kilowatt-hour), and cost (Levelized Cost of Electricity, or LCOE, which accounts for construction, operations, and maintenance over a plant’s lifetime). Here’s the breakdown, using 2025-2026 data.
Where Electricity Actually Comes From
Fossil fuels still dominate the grid, though the margin is shrinking. Coal leads at 34 to 35 percent of global generation, followed by natural gas at 22 percent. Hydropower holds steady at about 14 percent, making it the largest renewable source worldwide. Nuclear contributes around 9 percent, while wind sits at 8 percent and solar PV at 7 percent, with solar adding new capacity faster than any other source.
The remaining share comes from oil, biomass, and other sources. The trajectory is clear: solar led global energy supply growth in 2025, and renewables are outpacing new demand in many regions.
Environmental Impact: Lifecycle CO₂ Emissions
Lifecycle emissions are the fairest basis for comparison because they capture the full footprint of each source, from mining and manufacturing through operations and decommissioning. The gap between fossil fuels and everything else is significant.
Source | Approx. gCO₂e/kWh | Avg. Cost ($/kWh) | Other Impacts |
Coal | 740–1,000+ | $0.06–$0.15 | High air pollution (SOx, NOx, particulates); mining damage; water use |
Natural Gas | 400–500 | $0.04–$0.10 | Lower pollutants than coal; methane leaks and fracking concerns |
Oil | 500–1,000+ | $0.10–$0.20 | Similar to coal; rarely used for electricity generation |
Solar | 40–50 | $0.03–$0.08 | Land use; manufacturing footprint; end-of-life panel disposal |
Wind | 10–15 | $0.025–$0.08 | Minor land and wildlife impacts; manufacturing footprint |
Hydropower | 4–150 (varies) | $0.05–$0.15 | Ecosystem disruption; methane emissions from some reservoirs |
Nuclear | 5–12 | $0.07–$0.15 | Very low operating emissions; waste management and mining footprint |
Nuclear often edges out solar on a full lifecycle basis because of its high energy density and low operational footprint. Wind is consistently the cleanest source across all stages of production.
Cost: What New Power Actually Runs
LCOE represents the average cost per unit of electricity over a plant’s lifetime, making it the standard basis for comparing generation costs across different technologies. Renewable costs have dropped dramatically over the past decade.
Approximate unsubsidized LCOE ranges for 2025:
- Solar PV (utility-scale): $30–$80/MWh, often the cheapest new-build option
- Onshore wind: $25–$80/MWh, frequently the lowest-cost source overall
- Natural gas (combined cycle): $40–$100/MWh, competitive but exposed to fuel price volatility
- Coal: $60–$150/MWh, higher when carbon pricing or pollution controls apply
- Nuclear: $70–$150+/MWh, high upfront capital with low fuel and operating costs over time
- Offshore wind and hydro: $50–$150/MWh, wide range depending on site conditions
The catch with renewables: their cost advantage doesn’t account for storage or backup capacity needed to manage intermittency. When those system costs are added, the gap with dispatchable sources like nuclear and gas narrows somewhat.
Source-by-Source Reality Check
Fossil fuels (coal and gas) still cover 55 to 60 percent of global electricity and remain the backbone of grid reliability. Coal is the dirtiest source by a wide margin, and both face increasing cost pressure as carbon regulations tighten. Natural gas works as a transition fuel where the alternative is coal, but it isn’t a long-term decarbonization path.
Nuclear delivers massive, reliable clean power with a capacity factor above 90 percent and a land footprint smaller than any other large-scale source. Its main obstacles are upfront capital costs, long construction timelines, and regulatory complexity, not the technology itself.
Solar and wind are the cheapest options for new capacity in most markets and are responsible for the bulk of emissions reductions happening right now. Their limitation is intermittency: they produce power when conditions allow, not necessarily when demand peaks. Grid-scale storage is improving that picture, but it remains a real constraint.
Hydropower is the most mature renewable source, delivering reliable generation wherever geography supports it. The problem is that most of the best sites globally are already developed, limiting new capacity additions.
No Single Source Wins Everything
The transition away from fossil fuels is underway, but it isn’t linear and it isn’t simple. Different regions have different resource profiles, grid structures, and existing infrastructure. A coal-dependent grid in Southeast Asia faces a different optimization problem than a gas-heavy grid in the U.S. or a hydro-rich system in Scandinavia.
The general direction is consistent across all of them: more solar and wind backed by storage, a growing role for nuclear as baseload, and natural gas as a bridge fuel where needed. Fossil fuels will remain in the mix longer than climate targets would suggest is ideal, primarily because reliability matters and storage isn’t cheap yet.
The investors and operators paying attention to energy right now aren’t just watching generation costs. They’re watching storage costs, grid infrastructure investment, and the policy environment around carbon pricing, because those three variables will determine which technologies actually scale.
Sources: IEA, Ember, Lazard, Our World in Data, UNECE lifecycle analyses. Data as of 2025–2026.
Related Posts: Inflation is Rising | CPI and Your Losing Dollar | Lower Your Electric Bills