At DailyDime we like to make money talk easy to understand. One of the biggest money topics in economics is the money supply. That might sound boring, but it has a huge effect on inflation, interest rates, and even your stock portfolio. Two of the main measures of money are called M1 and M2. Let’s break them down and see how they move the economy.
What is M1?
M1 is the money you can grab right away. Think about the cash in your wallet, the coins in your piggy bank, and the money sitting in your checking account. This is money you can spend immediately. Economists call it the most liquid form of money because you don’t have to wait or trade it for something else before using it.
What is M2?
M2 is a bigger bucket. It includes all of M1 but also adds savings accounts, small time deposits like certificates of deposit, and money market mutual funds. You can’t usually swipe a debit card straight from these, but you can get to them fairly quickly. M2 tells us about the overall pool of money available in the economy, not just the part that is ready for instant spending.
A Video Game Analogy
Imagine you’re playing a video game and you have two types of money in your account. M1 is like the coins and gems you can spend right away in the shop. You can buy new gear, potions, or whatever you need instantly. M2 is like your savings chest back at your home base. It’s not in your pocket during the battle, but you can go back, open it up, and use it when you want to. Both counts matter. The coins in your pocket keep you moving now, and the chest of treasure shows how much wealth you have in reserve. That’s exactly how M1 and M2 work in real life.
How Money Supply Grows and Shrinks
The money supply doesn’t just appear out of thin air. Banks create more money when they lend. If you put $1,000 into your bank account, your bank can lend most of that money to someone else. That person spends it, and the person who receives it deposits it into their own account. The cycle continues and the total money in the system grows.
The Federal Reserve, often called the Fed, also plays a huge role. It can add money into the system by buying government bonds or lower the amount of money by selling them. The Fed sets key interest rates that influence how much borrowing and lending happens. During tough times like recessions the Fed usually adds more money to the system to keep things moving. When inflation is rising too fast, the Fed tries to slow money growth to cool the economy.
What Recent Data Shows
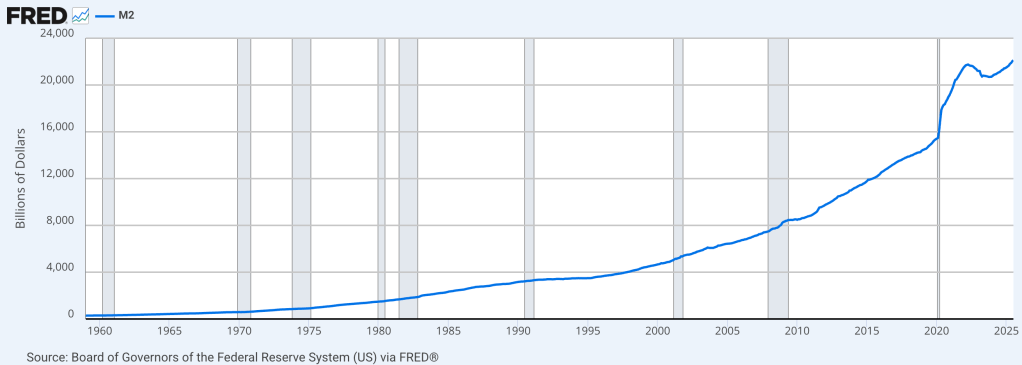
If you look at the M2 chart from the Federal Reserve (the M2SL series on FRED), you’ll see some wild moves in recent years. During the pandemic, M2 shot up as the government and Fed pumped money into the system through stimulus checks, loans, and other support. After that big surge, M2 growth slowed and even dropped for a while. More recently it has started climbing again, though not at the same crazy pace. Even so, the total amount of M2 today is still way higher than it was before the pandemic. That means there is still a lot of money floating around the economy.
Why Does This Matter for Inflation?
Inflation is when prices rise over time. When there is more money in people’s hands, they tend to spend more. More spending can mean higher demand for goods and services, which pushes prices up. That is why rapid growth in M2 often leads to inflation later on.
But it is not always that simple. If people decide to save instead of spend, inflation might not jump right away. Economists call this the velocity of money, which is how quickly money changes hands. If money moves fast, inflation rises faster. If money slows down, inflation can stay low even if M2 is high. Other shocks, like supply chain issues or oil prices, can also push inflation up even when money growth is flat.
The Stock Market Connection
The stock market and money supply are linked in interesting ways. When M2 is growing, there is usually more liquidity, which means money is easier to borrow and invest. That can push stock prices higher because investors have more cash to buy shares. Lower interest rates also make stocks look more attractive compared to bonds, which can add more fuel to rising prices.
On the flip side, when inflation starts to rise too quickly, the Fed usually raises interest rates to slow it down. Higher rates make borrowing more expensive and also reduce how much future earnings of companies are worth today. That can put pressure on stock prices.
Some parts of the market react differently. Companies that can raise their prices without losing customers may do well during inflation. Others, especially those with a lot of debt or that rely on long-term growth, may struggle.
What You Should Watch
The M2SL chart is a good starting point for seeing what direction money supply is moving. If M2 is rising quickly, it could mean higher inflation is coming in the next year or two. If it is slowing down or shrinking, inflation pressures may ease but the risk of recession can go up.
For stocks, strong M2 growth usually helps in the short run, but if inflation gets out of hand and the Fed slams on the brakes with higher rates, markets can drop. It’s a balancing act between money growth, inflation, and interest rates.
Wrapping It Up
M1 and M2 might sound like dry economics terms, but they are at the center of how our economy works. They affect how much things cost at the store, what your mortgage rate is, and even how your stock portfolio performs. By keeping an eye on the money supply, especially M2, you can get a peek into where inflation and markets might be headed.
At DailyDime we believe finance should be fun and clear. Think of M1 and M2 like your in-game wallet and treasure chest. Knowing how full they are tells you a lot about how the next level will play out.


Leave a comment